Yesterdays trading was quite funny..First they trapped all the bulls on the wrong side and then got everyone beared up and then trapped all the bears...Good for me..I used the initial weakness to close all shorts and go long...As I had updated in the post below...
We need to take a slightly longer term view and stick by it to survive in this market...no other way...As of now I am bullish for short term..only very short term...The trend can turn back down any time but for now, we need to play attention to the bullish case...For now...
If you are long, play with tight stops and keep booking profits...Thats the only way in this market.
Now one thing to note here the earlier bearish signals on the daily...macd and stochastics are giving some signals that they might be neutralised...Watch this place for more later..For now the bearish case is losing strength and the bullish one is gaining...lets see how it turns out over next couple of days...This might be the last gasp of the dying market...
Best.
Monday, September 1, 2008
Sunday, August 31, 2008
Morph Point
Well from my previous post, you would have seen my state of mind..lol..man i love that monkey...well it captures well the state of mind of traders..not only in our markets but globally...one day we go up, the other day we go down...confusing the hell out of everyone...well you would have got by now that I am confused..we are at a wave morph point...I will show one chart which was my earlier preferred scenario...and a 2nd chart after that which shows the other possibility which is also becoming strong day by day...the more bullish scenario...
First possibility...what i was looking at for all these past days...

2nd one...this one is gaining credence every day we go by..and we need to pay attention to this one here...being completely bearish is dangerous..

Hope you read my comments on the chart...I think we are in a strong 'morph' scenario..we need to give importance to both cases here..As you know I am short still from 4400..I am thinking I will cover today on initial weakness and maybe go long in small amounts..now dont get me wrong..I am still bearish..but see some upside in short term...
Comment welcome please...Good or Bad...
Best.
Saturday, August 30, 2008
State of Mind of the Nifty Trader!
Confusion confusion....what to do next....lol :-)

Weekend Analysis to follow soon....See above picture for my current state of mind..lol :-)

Btw, a note on this blog, we surpassed 10000 visitors a couple of days back...in just a few months I think...I admit there were slow periods in between due to my work and other commitments but hopefully we can maintain the momentum going forward. Thank you for supporting this blog with your visits and comments....!
Weekend Analysis to follow soon....See above picture for my current state of mind..lol :-)
Best.
Thursday, August 28, 2008
Expiry Day
Well market declined much more than what I expected it to in one day. However we are close to short term strong support(4200, 4150) so I do not rule out a fierce short term rally fuelled by short covering. Intermediate term and longer term, I do not see anything exciting to be bullish about but short term bears can feel some pain. Break 4160/4140 area and the bears will rule big time...Retest of the lows and even lower will come if this happens.
Trade Safe.
Best.
Trade Safe.
Best.
Wednesday, August 27, 2008
Make or Break!
More likely is break. Be extremely cautious here folks. I smell some serious danger ahead. Only thing I dont know yet is when the carnage will start. Over the past few days I have seen some very bullish messages around. Dont be fooled by all this noise. Let the market speak. What we have seen so far is weak hearted attempts to take out overhead resistances. But market says no. Today US markets look bullish so far..But I will remain net short from 4400 as I said I will do in previous update until I have a daily close above 4450 area. Then will reevaluate and post what I do next.
No charts today. Nothing has changed. Everything looks the same on the charts. The range compression we have seen so far says the next move will be a doozy...! Up or down is the big question and I vote for down until further notice! ;)
Best.
No charts today. Nothing has changed. Everything looks the same on the charts. The range compression we have seen so far says the next move will be a doozy...! Up or down is the big question and I vote for down until further notice! ;)
Best.
Sunday, August 24, 2008
Weekly Trends and Analysis
Analysis for the week ahead. I will present a bigger picture look at things after we look at the charts.
Starting with the daily. Some comments on the chart - open in new window to view. Here we can see the MACD is signalling danger. Last time it happened, we had a major downslide. Will we do the same this time? We need to watch this week very closely.

Next the weekly chart. Here the stochastics is trying to crossover to the downside. Last times it happened resulted in major mayhem in the markets. Break 4240 and its probably over for the market - Under this 4150 is also strong support but 4240 might be more important as its last weeks panic low.

Daily log chart shown here to present a different look at things. Note how we are back in the downtrending channel on this one.

Lastly hourly charts with comments on it. Nothing more to say here.


Overall charts and market are showing some confusing views. Prefer to sit out in cases like this. I am looking to build short positions at higher levels maybe starting today. So many strong resisitances at higher levels. This week being expiry week might see a lot of index management by the market makers. Might be a good idea to sit out...Daytrading can be done though. I have given some key nos in the charts above. Play in between these levels.
Okay now coming to the bigger picture.
Lets face it folks. We are in a major economic upheaval. We need to pay attention to the global picture also. Being in the US of A, I see things here and I am convinced beyond a doubt that we are probably in a very serious economic predicament - There are no jobs..Jobs are being cut as it is...People have stopped buying cars and houses...Overall tighening of spending. Flashback to 6 months back and it was very very different. People were upgrading their cars, their houses and so on...Its funny what a few months can do. The last few years saw people spending without any restriction money that they did not even have in the first place. Easy credit and uncontrolled spending is what lead to all of this. So pain is being faced right now and may continue for more time than what people are expecting.
Come home to India and as I said some time back, the PE growth in our markets have been quite pathetic over the past year. 8% or so. I mean that is really bad. We factor in inflation and the real growth becomes even more pathetic. We are in for some dire times folks. Be careful with your money.
BUT as they say, its always darkest before the dawn and the same is applicable here. Markets are a leading economic indicator. We will begin to recover before the broader economy. When?
I expect we shall see a major downturn over next few weeks...maybe a month and then go toward new lows....The next new low at maybe 3600-3400 levels will be a fantastic buying opportunity for the longer term. Again note that the levels and timeframes here are more of speculation that anything else. Take it with huge handfuls of salt :)
Its my longer term view on the markets and economy and so will be continuously updating them...I think we shall make a significant bottom within next 3-4 months...Then a big upmove into March of next year...More decline/consolidation after that...But let us see how the next few months play out first.
Best.
Thursday, August 21, 2008
Is it over?
Not looking good folks...Yesterday was a clear harbinger of things to come..I was expecting a bigger and better bounce but did not happen to the extent of what I thought. But yesterday's market has damaged the charts and I do not see an easy way out of this....
Weekly stochastics has more or less crossed over to the downside. Weekly MACD did the dreaded kissback I was talking about and rolled over. Daily MACD also issues a sell..So what gives? We can see maybe a very small bounce today but ultimately I see a lot of weakness for us in medium term...Retest of the lows and maybe lower is on the cards.
Yesterdays market left me very frustrated. Market is doing pretty much what I expected it to do but I am just not timing my trades right...Or in other words trying to do too much and catch every swing... :( Probably I need to learn how to sit tighter in my trades!
But well better luck next time then.... ;)
BTW, how was my GOLD call? Good profits very fast...lol...Anyone made use of it?
Best.
Tuesday, August 19, 2008
Market Update - August 20th 2008
Later when I posted market thoughts, I mentioned we should have weakness and then strength later in the week. Played out pretty much as expected. Now the weakness might be over or very close to over. Yesterdays lows are important...Or slightly lower at approx 4270 levels. Below this the most important number as stated before is 4150.
I am trying to build some longs right now - this will be a very short term position..Or a scalp only...I will bail on weakness or if I get something close to 4520. But lets see how it plays out.
See hourly below. We look like we are very close to some important support levels. I think its critical we hold this area where we are at now.

Next the daily - I have added some notes on this. Nothing much more to say.


I will post a 'Big picture' article after some time.
Best.
I am trying to build some longs right now - this will be a very short term position..Or a scalp only...I will bail on weakness or if I get something close to 4520. But lets see how it plays out.
See hourly below. We look like we are very close to some important support levels. I think its critical we hold this area where we are at now.

Next the daily - I have added some notes on this. Nothing much more to say.

Then the weekly. Again same thing..Notes on the chart. We are quite close to a big intermediate term decline but before that I am expecting a decent bounce. How much we bounce I do not know yet..But it could very well be a lower high...Watch carefully - Things could get quite ugly soon. I think longs are risky unless you are very nimble....I am also looking to build up some shorts at higher levels.

I will post a 'Big picture' article after some time.
Trade safe ;)
Best.
GOLD!!
Well folks...The GOLD bug has finally bitten me...lol :)
See chart below...I figure its in a nice ABC correction after which a good uptrend should start again....

See chart below...I figure its in a nice ABC correction after which a good uptrend should start again....

Other reasons why GOLD should go up is flight to safety and inflation. Overall its a good a safe place to park some money. I believe we have some very tough times ahead and GOLD is a good place to park some money. I am buying GOLDBEES..No leverage...Bit by bit until I build a sizable position. Again note that this is a long term position without leverage so I will not be worried about short term price blips...
And we are very close to long term supports. The 770-740$ area is extremely strong support.
Buy the dips...
Watch out for my 2 next posts probably today itself where I will go over market thoughts and also take a look at the bigger picture....Tech and Funda...Will touch over GOLD again then.
Best.
Sunday, August 17, 2008
Market Update - Monday Aug 18th
Quick update today..Not posting any charts..Earlier posted charts still hold valid.
Now at this point, I am very uncertain about market direction..My gut says we are going to dip very hard in the first half of the week and then MAYBE we recover after that.
Either way, nos to watch is 4480 on upside, 4420 and 4350 on downside. Deep support is 4150..Below this, bears will rule big time..
I might just stay out and watch this week until I get some more clarity. I favour downside for now as I said last week 4470 was important - We broke that convincingly. So bears have the upper hand short term...Intermediate term, bulls have to hold 4350 If not, its a clear ride to 4150...And if thats broken, God save the bulls.
On a different note - One analyst whom I respect a lot and whom I also consider as a mentor of sorts - Rajan Sir has started a new blog - http://niftyspotter.blogspot.com/
Check it out...I will be adding this link also to my blog lists on the right shortly...
Best.
Wednesday, August 13, 2008
Range Bound again for Now
Not much to update today. Hope everyone enjoyed reading the earlier extensive analysis. I mean this to be more of followup than anything else.
Anyways one thing to note is that over past 3 days, market has turned significantly weaker. The high so far is 4650 around and recent low is 4470. Until 4470 is broken, bulls are safe but I expect will be broken sooner than later. Only question is how far high up do we go?
No easy answer but lets look at the daily. Put up in log scale on the advise of Kpl sir and several others...Looks interesting..As of now market looks like its broken out of the channel and is teetering on the edge...Which is why I said earlier low 4470 area is important - Break this and trade below for some time and the top is in - 4650. If we can go above 4620-4650, we again open up targets of 4720-4750. This itself might be very difficult to attain so I have no expectations of above this. I would give odds of 4650 being the top quite high. Lets see if 4470 breaks.

Heres the hourly. Pretty much substantiates what I wrote above...Watch 4470-4450 on downside and 4620-4650 on upside. In between we will just be rangebound and volatile.

It would be interesting to see how the SEBI meeting outcomes(nothing much) affects the market today.
You all have a good long weekend and Happy Independence Day in Advance! ;)
Best.
Saturday, August 9, 2008
Another Fascinating Juncture
Another interesting week of trading has gone by and the next 2 weeks for me will be very very interesting and important...Now almost all weeks are like this so you might wonder whats so special about this one?...I will explain. Lets start with the weekly.
 Now what is important here is that the MACD has turned up and is on the verge of breakout out upward...BUT see the last time we were this close...It just kissed back and failed. I will be watching this one very intently for the signals that the same will happen.
Notice also how the stochastics gave an important intermediate term buy and is still on a buy.
I have been hammering the table about this important gem for a long time.
If I were to take a guess, I would say another kissback and failure for the MACD but let the market tell us that.
Now next the daily. We have a breakout out of the channel and we are targetting higher levels of 4720-4750. Important fibo levels in both retracement terms of the bigger decline and the recent more smaller decline. 4800 odd should be tremendous resistance and I would wager we fail before we get there...

I also think that the next SIGNIFICANT low will be a major major BUY point. You can refer my counts from earlier and see why I think so. ABC-X-ABC after which a big multi-month rally.
This is still what I am thinking and still sticking with it.
Here is the chart I had posted some time back. See the lines drawn predicting possible moves for the market and see market action up to date. It performed quite well for me and was able to make some bucks. However its still sad how ppl ridicule EWT..Recently on a forum I frequent many folks came out making fun of EWT...Its funny when ppl do not understand something, then like to laugh at it..I dont hold it against them...Its just ignorance.

I make it a point never to belittle a new method but instead try to understand and prove it right or wrong...If its useful, its a good tool to add to your arsenal. If not, well let it go. This is the hallmark or a good trader. Also finding out what works for you and sticking with it. Its very important to be open to new ideas when trading in the financial markets.
Okay enough of preaching. Lets look at the hourly also. At this point nothing is clear from this one. I am not going to try to count the subwaves because it is just not clear...I do believe however that we are still doing an ABC correction upward after which we should go lower...
Maybe a retest of 3800 or maybe a bit lower. Again dont expect this to happen all of a sudden. Tops and Bottoms are very painstaking affairs. Give it time.
Fundamentally speaking, I was looking at EPS data of the NIFTY for this year and was shocked to see we have a very miserly growth figure of 8% odd last year. This is quite shocking and way below what I was expecting. And with the RBI tightening down on things, we need to pay attention here. Maybe its time to put the INDIA SHINING story on the back burner for some time and just play the market trading the swings.
Comments are welcome please. This is what will give me incentive to post and also will heighten discussion and well enliven up things more!
Trade Safe and Have a Great Week! ;)
Best.
Tuesday, August 5, 2008
Market Update - Aug 5th

Bullishness is back on the street...I was bullish from the lows...now slowly turning bearish...we may get atleast a pullback from this levels...We need to see the nature and extent of the pullback to decide whether to buy the dip...
Market can go up to 4750-4800 area on this move...Before that, we can have some pullback...Or a serious dip...If we go below 4350, then it will be a much bigger correction or start of a new bear move...Any corrections that stay above it may just be a smallish correction.
Note how the stochastics are in the range of highs where it has signalled the start of a new correction or bear move...Better to book profits in longs if you have any...
I have started some small shorts which I will be looking to add to over next few days if we go some more higher...Taking each day as it comes...
Best.
Thursday, July 31, 2008
Correction...The Bigger Picture
The bigger picture on the past 6 months correction. I know there are other possible and more bullish alternates but I prefer this one until I see evidence disproving this. All my comments are on the chart - Open in a new window to view.
 EWT can be confusing to newbies but I will be happy to explain in case anyone has any questions.
 EWT can be confusing to newbies but I will be happy to explain in case anyone has any questions.
Best.
Wednesday, July 30, 2008
Market Update - Some possible outlines

Nifty chart updated and attached...I have outlined 2 possible moves that I see possible over next few days...We are still in a corrective bounce aka a bear market rally...We went up to the 50% retracement area approx 4500 and then corrected 50% of THAT advance to the recent lows made in the past couple of days...So far so good...
Next what can happen is defined...This is a B wave...So we should go up again and resist somewhere above...Either at the downtrend channel boundary or we should go above and stop at the 61.8% retrace of 4720...Either way in my opinion upside is limited in the short term...I will be looking to disinvest all of my holding over the next few days to 1 week...
Trade safe...When this rise gets done, I expect some strong and extreme carnage to happen again.
Very short term - We are bullish.
Medium term - We should turn bearish again.
Anyone have questions? - Please post in the comments section or on the chatbox.
Best.
Thursday, July 24, 2008
Critical Juncture
Again we seem to be at a very critical junture in our market...Open below chart in a new window to see what I am talking about. This can be a valid count but we obviously need more information before taking a sure call on the market direction...The low that will be set today should be very important I think....Trade safe.
The other thing is the possibility of another potential island reversal forming..because of the earlier huge gap up and a similar gap down today can together create a island similar to the one we had a few months back.
Best.

The other thing is the possibility of another potential island reversal forming..because of the earlier huge gap up and a similar gap down today can together create a island similar to the one we had a few months back.
Best.

Wednesday, July 23, 2008
Bulls back with a Bang!
What a week...Bear market rallies are quick and furious and will rip out the frigging lips of all the bears...lol...What next?...I have posted this here several times and its very clear what its indicating so am not going to write anything more on this chart...


So what next...?...I see a decent pull back over the next few days to 1 week...We will look at the nature of this pullback to look at opportunites to add longs...At this point I am only seeing this as a bear market rally but it is a rally nevertheless...its not over yet...and can be profitted from...Which is why I cannot understand the die hard bears still calling for 3600...We also had several TV analyst dumbos calling for 3000 and lower on nifty...They got their heads handed to them on a platter...which is why I am totally against following the TV analysts..lol
Best.
Saturday, July 19, 2008
Do or Die Week
Friday was fun..Finally a good day for da bools :-) And about time too...
Some bears would have gotten clobbered on Friday...What next?...Its the end of the week, so lets look at weekly chart below...One thing...I have mentioned how important this is before...Stochastics crossover on the weekly...One of the best bottom spotters in my book....The only problem is this next week is one filled with external news events...No need to tell anyone what it is...Tuesday will be very important for our markets...
I was thinking we get one more low..maybe a higher one..but market had other ideas it seems...
For now, for the bulls, the stop is around 4050(tight stop), 3960-3920 levels is the final stop to keep the bull case alive...Dont be long below 3920...This the line in the sand for me...After 4050 ofcourse...
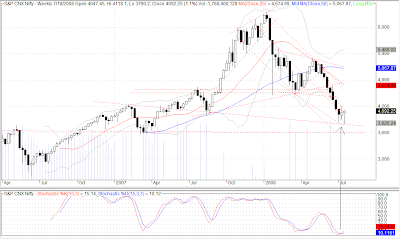

I have a straddle strategy in options to profit either way...let us see if it works! :)
If the govt does NOT fall, a super bear rally to the top of the channel will happen...approx 4500 will come...So much depends on this that it makes some sense to sit out of the market or gutsy players can try some option strategies...to profit either way...
Have a good trading week.
Best.
If the govt does NOT fall, a super bear rally to the top of the channel will happen...approx 4500 will come...So much depends on this that it makes some sense to sit out of the market or gutsy players can try some option strategies...to profit either way...
Have a good trading week.
Best.
Thursday, July 17, 2008
One More Low?
Past few days market action has been cautiously bullish...lot of it on short covering...Actual buying has been missing in this market...Everyone and their uncle is bearish now..Maybe we need to start being bullish...albeit very slowly...
I see possibility of one more low...possibly a lower low at around 3650-3700...I will also be happy with a higher low...Before we lauch into an intermediate term rally of maybe 1-2 months...After which there is more carnage on the cards...So this is still a traders market...Keep that in mind...If trading on the long side, its been very tough to hold on to gains..Trends change almost immediately and without much warning...The short side has been easier to play...Lots of time to cover etc etc...Character change in the market...We need to watch for this to change...
Some positives and bullish signals exist on the charts..We can see an exhaustion of selling..However buyers seem to be on strike...But when they come back, we can see some quickfire upside...
Why do I say one more low?...Because the wave structure is suggesting that...Again I will be happy with a low at 3800 also...Ideal will be 3650 to get long aggresively...
So to sum up I am bearish very short term...medium term cautiously bullish...long term clearly bearish... :)
Daily chart below...You can see the lines of importance in here...These will be in play over next few days...Looks like we are going to play within this channel for a pretty long time!

Best.
Monday, July 14, 2008
Rangebound...For NOW...
3 lines (and a bearish flag) defining the market now..It needs to breakout or down to begin some moves...


US market action today looked like it was hammering out a bottom...Todays lows will be very important.
In our mkt, some stocks interesting on the long side are asian electronics and selan exp...Check it out...
General market looks rangebound only...Either the flag needs to breakdown conclusively and target 3850 and lower toward 3620 area...OR we need to breakout above 4220 and rocket upward...Market might be waiting to see the results of the govt confidence motion...If govt does not fall, we can see a rocket move upward...However this wave is turning out to be quite difficult to play...Play the lines as shown above.
Best.
Subscribe to:
Posts (Atom)

